


Trading in financial markets is akin to navigating a vast ocean with variable weather conditions. Navigating these unpredictable market conditions depends on one’s ability to read and interpret various market indicators—the nautical charts and compasses of the trading world. One such powerful tool at a trader’s disposal is the candlestick chart. This article focuses on using candlestick charts effectively to identify potential entry and exit points in the market. Keep reading to learn more.
Understanding the Basics of Candlestick Charting
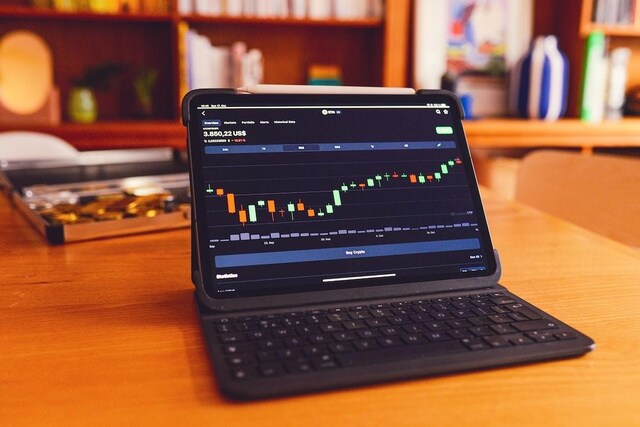

In a candlestick chart, each candlestick represents a specific time period and illustrates four key pieces of information: the opening price, the closing price, the highest price, and the lowest price during that period. Understanding this basic framework is the first step in decoding the information hidden within these charts.
The ‘wicks’ or ‘shadows’ above and below the body represent the highest and lowest prices reached during the period. A long upper shadow shows buyers pushing prices up, whereas a long lower shadow shows sellers dragging prices down. The relative lengths of the shadows can provide valuable clues about who controls the market: the bulls or the bears.
Candlestick Patterns and Their Significance
Just as individual words can be combined to form meaningful sentences, individual candlesticks can form patterns that convey additional insights about market trends. These candlestick patterns can be classified into two categories: continuation patterns, which suggest that the existing trend will continue, and reversal patterns, which indicate a potential change in trend direction.
An example of a continuation pattern is the bullish flag, which comprises a sharp price rise followed by a period of consolidation. The pattern is completed when the price breaks out of the consolidation phase to resume its upward move. This pattern is seen as a positive indication of future price growth.
On the other hand, the evening star is an example of a reversal pattern. This three-candlestick pattern starts with a strong bullish candle, then a small-bodied candle that gaps up, and ends with a large bearish candle that closes within the first candle’s body. This pattern is a strong signal of a potential bearish reversal. Spotting these patterns early can provide traders with valuable leads for setting their entry and exit points. Setting Entry and
Exit Points Using Candlestick Charts
Imagine you’ve identified a promising bullish flag pattern on your candlestick chart. How do you strategically set your entry and exit points? The beauty of candlestick charts lies in their potential to provide clear visual cues for these crucial decisions. Once the flag pattern is completed, a trader might set their entry point at the level where the price breaks out of the consolidation phase, signaling the resumption of the uptrend.
Exit points, however, are a little more subjective and are usually based on either profit targets or stop-loss levels. A common approach is setting the exit point at a fixed percentage above the purchase price, thus locking a certain profit level.
Advanced Candlestick Techniques: Using Volume Data
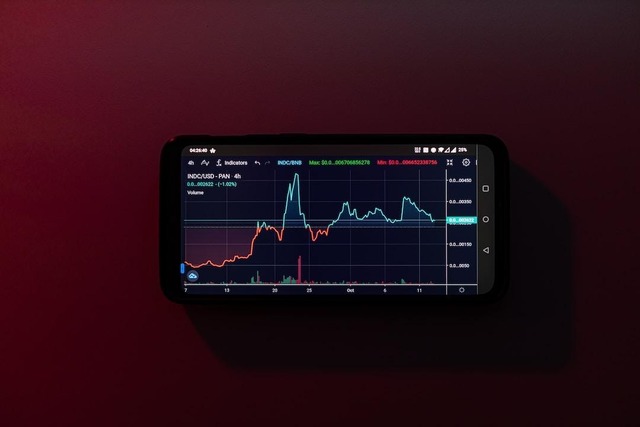
The next level in candlestick charting involves combining it with volume data. Volume refers to the number of shares traded during a given period. It’s a crucial aspect of trading, often overlooked by novice traders, that can significantly bolster the signals provided by the candlestick charts.
Consider a bullish engulfing pattern—a reversal pattern consisting of a small-bodied bearish candle followed by a large-bodied bullish candle. This is a sign of a bullish reversal. But suppose an increase in volume accompanies this pattern. In that case, the signal for reversal becomes even stronger as the volume increase indicates that a new influx of buyers has entered the marketplace.
In contrast, if a bullish pattern arises but no volume increases, the signal becomes less reliable, indicating that the uptrend may lack robust support. Therefore, using volume data alongside candlestick charts can significantly enhance trading accuracy.
The key to successful trading lies in developing a sound understanding of various market indicators, including candlestick charts, and implementing a robust, emotion-free trading strategy.


