


Introduction
Understanding how to use a trade value chart can make the difference between a fair trade-in and losing thousands of dollars on your car’s worth. A trade value chart isn’t just a static price list it’s a real-time indicator that combines market trends, vehicle condition, regional data, and depreciation metrics to determine what your car is truly worth.
Whether you’re planning to trade your old car for a new one, sell it privately, or simply estimate its equity, mastering the trade value chart empowers you to make data-backed decisions and negotiate confidently with dealerships.
This comprehensive guide covers every step of the valuation process from gathering accurate vehicle data to understanding how mileage, seasonality, and even EV trends affect your trade value.
Gather Essential Vehicle Information Before Using a Trade Value Chart

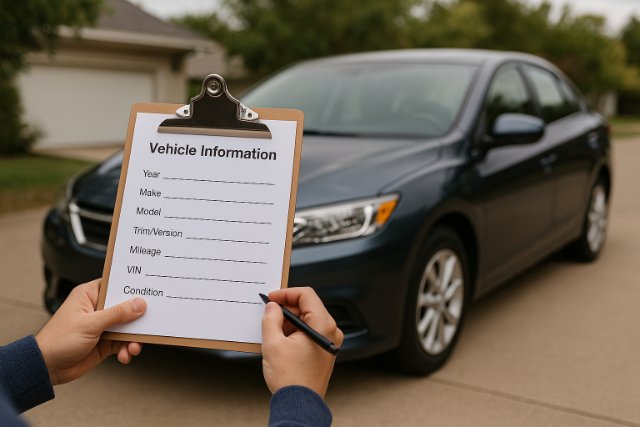
Before consulting any trade value chart, you must assemble complete and precise information about your car. The trade-in process starts with transparency any missing or incorrect data will skew your estimated value.
Begin with your VIN (Vehicle Identification Number), a unique 17-character code that identifies your vehicle’s manufacturing details, accident history, and recorded mileage. Platforms like Kelley Blue Book (KBB), NADA Guides, and Edmunds rely heavily on VIN data to match your car to accurate market comps.
Next, confirm key specs: make, model, year, trim, drivetrain (AWD/FWD/RWD), transmission type, color, and installed features. Even optional add-ons like leather seats, sunroofs, or infotainment upgrades can influence trade value by hundreds of dollars.
Lastly, ensure that your odometer reading, maintenance records, and title status are up to date. Incomplete or mismatched records can trigger lower scores on trade value charts, as dealerships may assume undisclosed issues.
Check Market Listings to Establish a Realistic Value Range
Once your vehicle data is ready, compare it against current market listings. The automotive market fluctuates weekly based on demand, supply, and economic factors, so it’s vital to align your car’s valuation with real-world listings.
Browse platforms like AutoTrader, Cars.com, and CarGurus to see active listings for the same make, model, and year in your region. Record the high, low, and median prices.
Then, cross-reference this data with trade value charts from KBB, Edmunds, and NADA. You’ll often find that your trade-in value sits 10–20% below the private sale price a reflection of the dealer’s reconditioning and resale costs.
If your region faces vehicle shortages, such as during inventory crises or high fuel prices, your trade value may temporarily rise, allowing you to negotiate from a stronger position.
Compare Top Trade Value Tools and Their Unique Algorithms
Different valuation tools interpret data differently. Understanding their distinctions ensures you use them strategically.
| Valuation Source | Primary Data Used | Market Focus | Update Frequency | Best For |
| Kelley Blue Book (KBB) | Retail & private listings | Consumer retail | Daily | Negotiation benchmarks |
| NADA Guides | Dealer and lender sales data | Wholesale & financing | Weekly | Loan and insurance valuations |
| Black Book | Auction and fleet data | Dealer wholesale | Weekly | Dealer-level comparisons |
| Edmunds | Real-time online listings | Retail and private | Daily | Consumer price matching |
| Carfax History-Based Value | VIN & accident records | History-weighted value | Dynamic | Adjusting for damage and mileage |
Each of these sources uses a different valuation algorithm. For instance, KBB weighs retail listings and consumer data, while Black Book bases its numbers on dealer auction results. Combining multiple charts creates a balanced and more reliable trade value range.
Analyze How Dealerships Use Trade Value Charts
Dealerships rely on trade value charts internally to set offers that protect their profit margins. They typically input your vehicle details into systems that cross-reference Black Book, Manheim Market Report (MMR), and NADA values.
Their charts account for factors you might not consider, such as wholesale market fluctuations, reconditioning costs, and inventory turnover rates.
By understanding this, you can anticipate their pricing logic. If a dealer offers significantly less than the average trade value chart suggests, ask which data source they’re referencing. This encourages transparency and often leads to fairer negotiations.
Evaluate Your Car’s Physical and Mechanical Condition

The most overlooked factor in trade value calculation is vehicle condition. Trade value charts categorize vehicles into four primary tiers Excellent, Good, Fair, and Poor each representing specific standards.
- Excellent: Like-new appearance, flawless maintenance, and clean history.
- Good: Minor cosmetic wear, no mechanical issues, and full documentation.
- Fair: Noticeable wear, small repairs needed, average maintenance.
- Poor: Significant cosmetic or mechanical problems, incomplete records.
If you’re unsure where your car fits, schedule an independent appraisal or use AI-powered photo appraisal tools like those offered by Edmunds and Carvana. A small investment in detailing or minor repairs like replacing tires or buffing paint can often boost your trade value by hundreds of dollars.
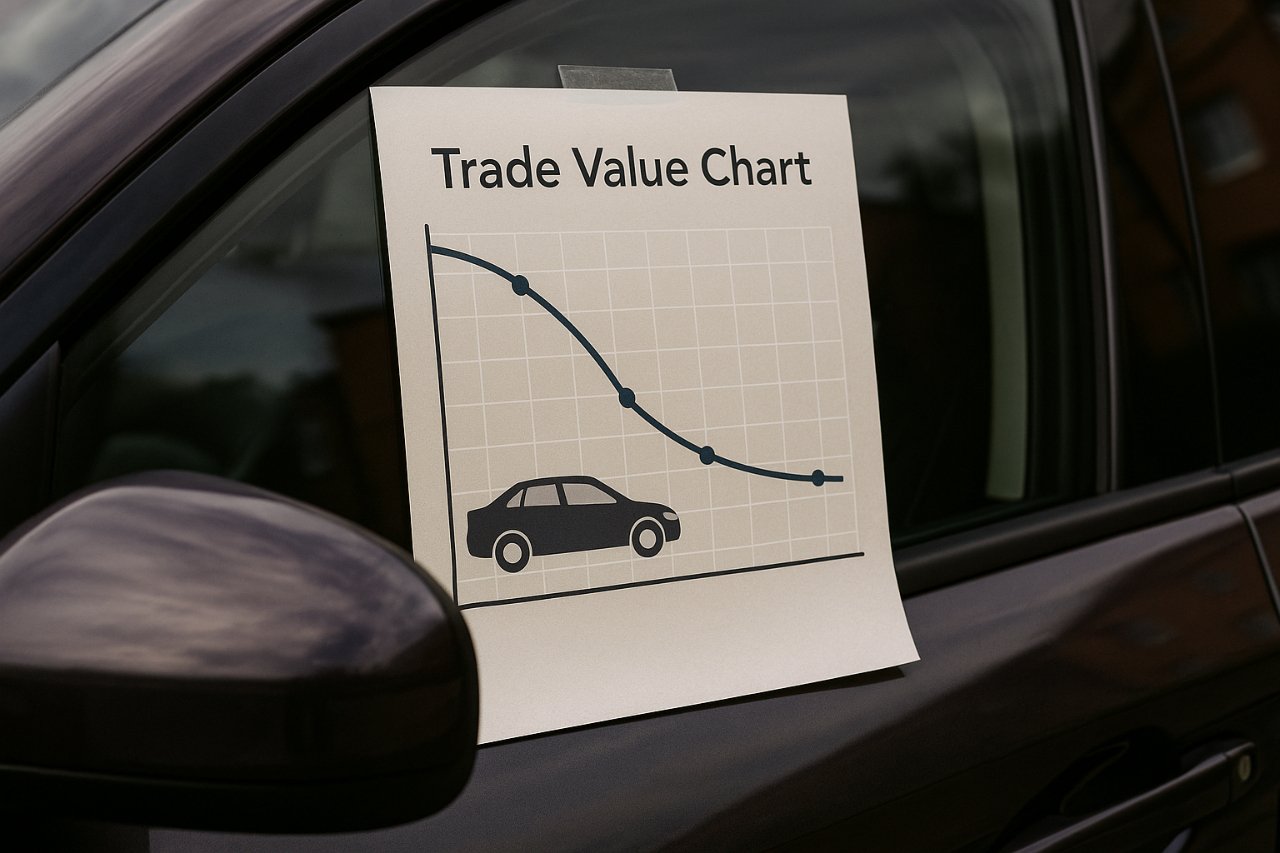
Understand Depreciation Curves and Value Retention
Every vehicle depreciates, but at different rates depending on brand, model, reliability, and demand. The trade value chart visualizes this with depreciation curves showing how your car’s value declines over time.
| Year of Ownership | Estimated Value Retained | Average Depreciation |
| 1 Year | 85% | 15% loss |
| 3 Years | 65% | 35% loss |
| 5 Years | 50% | 50% loss |
| 7 Years | 35% | 65% loss |
Brands known for longevity like Toyota, Honda, and Lexus retain more value than luxury or performance brands that depreciate faster.
Timing your trade-in based on these depreciation stages ensures you don’t hold your car beyond its optimal resale window.
Adjust for Mileage and Usage Patterns
Mileage heavily impacts trade value. Cars averaging 12,000–15,000 miles per year maintain predictable depreciation, but anything beyond that triggers accelerated value loss.
Trade value charts typically reduce prices by 3–5% for every additional 10,000 miles over the average.
However, context matters: highway mileage is considered less damaging than urban driving due to reduced stop-and-go wear. Include this detail when using valuation tools that allow “usage pattern” inputs.
Vehicles with documented long highway commutes may appraise higher than expected because of consistent performance and fewer mechanical stresses.
Factor in Location and Seasonal Market Trends
Trade value charts often apply regional adjustments. For instance, pickup trucks and 4WD vehicles retain higher trade value in snowy or rural states, while compact and hybrid cars perform better in urban or coastal markets.
Seasonality matters, too. Convertibles rise in value during summer, while SUVs peak in winter. Dealers use predictive modeling to forecast these cycles, which is reflected in dynamic trade charts.
If possible, time your trade-in to coincide with demand peaks. Selling a convertible in January or a truck in July will likely result in undervaluation.
Include Vehicle History Reports and Service Documentation
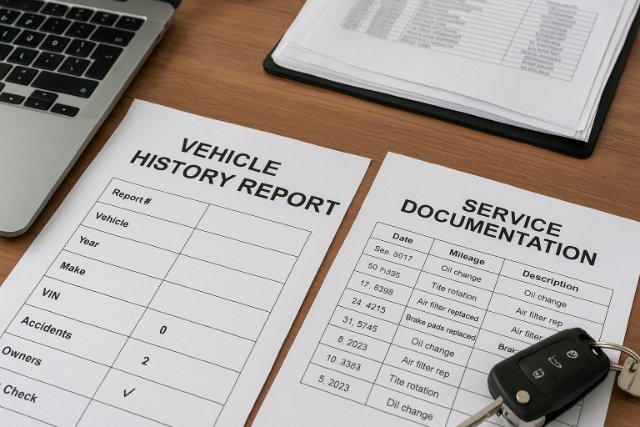
Your car’s history can either strengthen or weaken your trade value score. Always provide a Carfax or AutoCheck report during the appraisal process.
A clean accident record, regular maintenance intervals, and consistent ownership history can add 5–10% to your trade value.
Keep receipts for major repairs or upgrades, and present them neatly organized. Even routine services like oil changes or brake replacements show responsibility something trade value algorithms weigh positively.
Incorporate Technology Features and Modernization into Valuation
Today’s trade value charts consider technological features more heavily than before. Advanced driver assistance systems (ADAS), adaptive cruise control, backup cameras, and connectivity packages all contribute to higher valuations.
Conversely, vehicles lacking these features may experience faster depreciation, especially as safety and convenience standards evolve.
When using valuation tools, select the most accurate options for your trim level and package. Misrepresenting or omitting these features could cause valuation discrepancies of up to $1,000 or more.
Evaluate the Impact of Electric and Hybrid Vehicle Trends

Electric and hybrid vehicles (EVs and HEVs) have unique trade value trajectories. Their value depends not just on age and mileage but also on battery condition, warranty coverage, and technology obsolescence.
EVs can depreciate faster than gasoline vehicles due to rapid model updates and government incentives on new EVs. However, hybrids like the Toyota Prius often retain exceptional value due to fuel efficiency and reliability.
Trade value charts for EVs typically integrate battery degradation data, charging cycle history, and software update frequency.
Before trading in an EV, request a battery health certificate it provides proof of longevity that directly increases trade-in value.
Use Historical Price Data to Predict Future Trade Value
Historical trade value trends reveal how your car’s price moves over time and can help forecast the ideal selling window.
Websites like CarGurus Price Trends or TrueCar Insights display graphs showing average listing and trade values across months or years.
If your model’s prices have been stable or increasing, waiting a few months might yield a higher return. However, if prices are trending downward, trading in sooner can prevent further depreciation.
Prepare Your Vehicle for Appraisal and Inspection
Before visiting a dealership, prepare your vehicle to make the best first impression.
- Wash and detail the exterior thoroughly.
- Vacuum and deodorize the interior.
- Fix small cosmetic issues (scratches, dents, or lights).
- Replace missing accessories (mats, manuals, spare tire).
Presentation matters dealers associate a well-maintained appearance with better mechanical care, often resulting in higher trade offers.
Negotiate Trade Value Strategically
When it’s time to negotiate, lead with your research, not emotion. Present your average trade value range (for example, $14,200–$14,800) and back it with data from at least two valuation sources.
Dealers expect negotiation don’t hesitate to ask how they derived their offer. Use phrases like:
“According to Kelley Blue Book and NADA, my car’s trade-in range is between $14,000 and $15,000. Can you explain your valuation method?”
Keeping negotiations factual helps you avoid emotional pressure tactics. If you don’t receive a fair offer, don’t hesitate to request written appraisals from multiple dealerships.
Decide Between Trading In and Selling Privately
Once you know your trade value, compare it with the potential private sale price.
| Selling Method | Average Value | Convenience Level | Time Required |
| Dealer Trade-In | Lower (10–20% below retail) | High | 1–2 days |
| Private Sale | Higher | Medium | 1–3 weeks |
| Online Instant Offer | Mid-range | Very High | Instant–2 days |
If you prioritize speed and convenience, trading in is best. But if your goal is maximum profit, selling privately often yields a higher net return.
Monitor Post-Trade Performance for Learning
After trading in your car, observe how the dealer lists and prices it. This feedback loop helps you gauge the accuracy of your valuation.
If your traded vehicle appears online within a week at a significantly higher price, calculate the markup percentage. A 10–25% markup is normal; more than that could indicate undervaluation.
Document this experience it refines your future approach to trade value estimation and negotiation.
Conclusion
A trade value chart is a powerful decision-making tool that translates market intelligence into actionable pricing insights. By combining detailed vehicle data, historical trends, condition analysis, and valuation tools, you can establish an accurate, fair estimate of your car’s true worth.
Mastering this process empowers you to negotiate effectively, avoid lowball offers, and maximize your vehicle’s equity at trade-in. With the right preparation, your next trade can be a strategic financial move not a guessing game.
Explore more insightful and valuable content on our blog VeoTag.com! Stay updated with helpful tips, expert advice, and in-depth articles that enhance your knowledge.
Read Also:
1. Animal Cell Diagram: Complete Guide to Structure and Function
2. MyInstants: The Ultimate Guide to the Internet’s Favorite Meme Soundboard
3. Abraham Lincoln’s Hat: The Icon and the Legacy of a President’s
4. Dandy’s World: The Complete Guide to Mastering
5. Cute Halloween Drawings: Create Adorable Spooky Art
FAQ’s
Most valuation platforms update daily or weekly based on new retail, auction, and wholesale data to reflect real-time market shifts.
Sudden drops usually result from new model releases, rising fuel prices, or high inventory levels that reduce dealer demand.
Yes. Basic detailing, replacing worn tires, and fixing small cosmetic flaws can raise trade value by up to 10%.
Yes. Lenders often use NADA trade values to determine loan-to-value ratios for auto financing and refinancing.
Generally yes, due to rapid battery advancements and new EV incentives. However, hybrids tend to retain stronger long-term value.
Absolutely. Using at least two or three sources helps balance discrepancies and ensures your valuation reflects the real market average.


